archiveAug 16, 2020
ELF Analysis Tools
Practical notes on objdump, strace, ltrace, and readelf for inspecting ELF sections, symbols, syscalls, and dynamic linking.
Objdump
- Part of GNU Binutils
- Works well for disassembling non-obfuscated binaries
- Can read any ordinary ELF format
Sample binary
// gcc -o test test.c
#include <stdio.h>
#include <stdlib.h>

int main(char argc, char** argv) {
        unsigned char n;
        printf("%s\n",argv[1]);
        return 0;

}- Dump every section, data, and code:
objdump -D <./binary>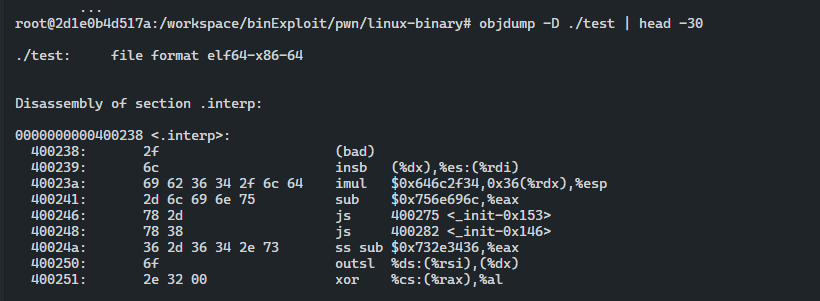
- Dump program code only:
objdump -d <./binary>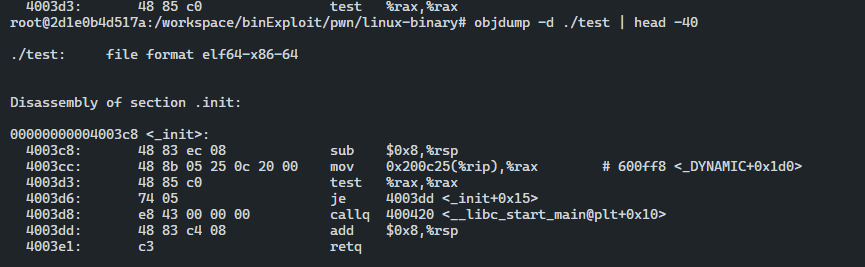
- Dump all symbols:
objdump -tT <./binary>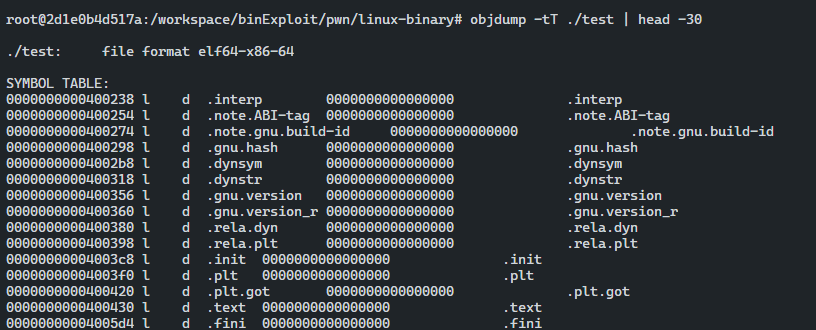
Strace
- System call tracer
- Built on the
ptrace(2)system call - Uses
PTRACE_SYSCALLin a loop to show syscall activity and signals while a program runs - Useful when you need to see which syscalls a process makes during debugging or live execution
strace /bin/ls -o ls.out

// Trace a programstrace -p <PID> -o daemon.out
// Attach to a running processSYS_read(3, buf, sizeof(buf));
// Early output shows the file descriptor for each syscall that takes one as input.strace -e read=3 ./test
// Use -e write=fd to inspect recorded write data.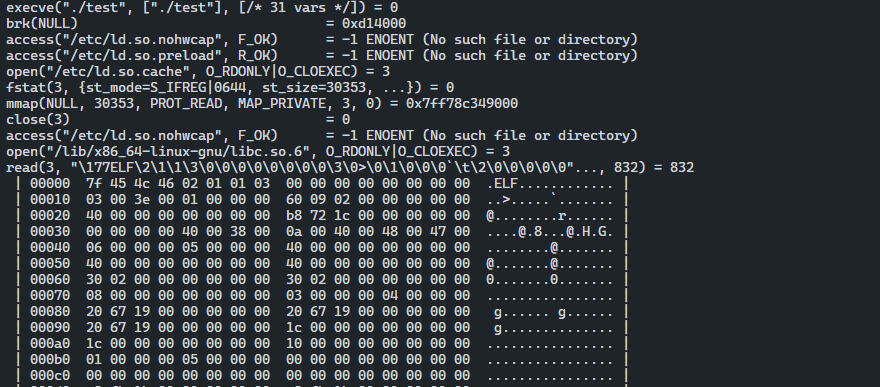
ltrace
-
Library call tracer
-
Similar to strace
-
Parses the program's shared-library linking info and prints the library functions in use
-
Add
-Sif you also want system calls alongside library calls. -
It parses the dynamic segment and prints symbols and functions from shared and static libraries for a deeper view.
ltrace ./test -o test.outreadelf
- One of the most useful tools for ELF analysis
- Pulls object information from essentially every bit of ELF metadata
- Commonly used for symbols, segments, sections, entry points, data, and dynamic linking details
Section header table
readelf -S ./test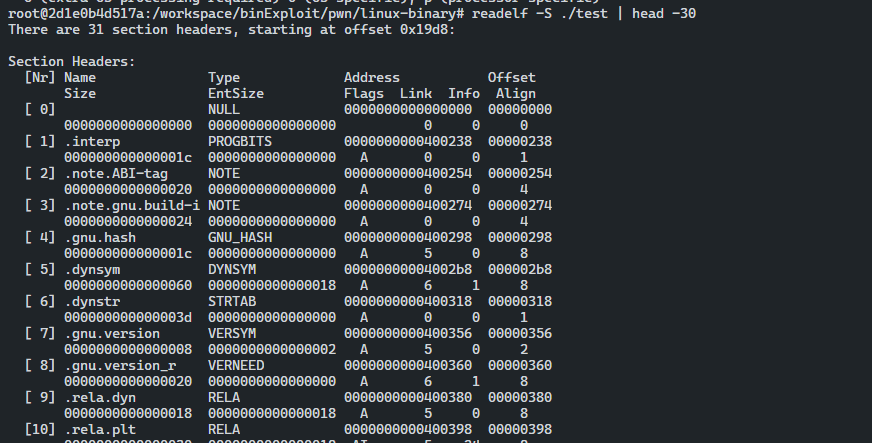
Program header table
readelf -l ./test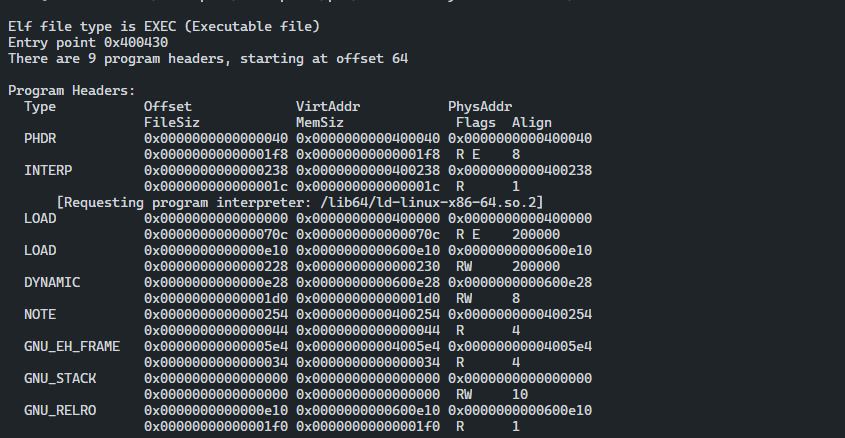
Symbol table
readelf -s ./test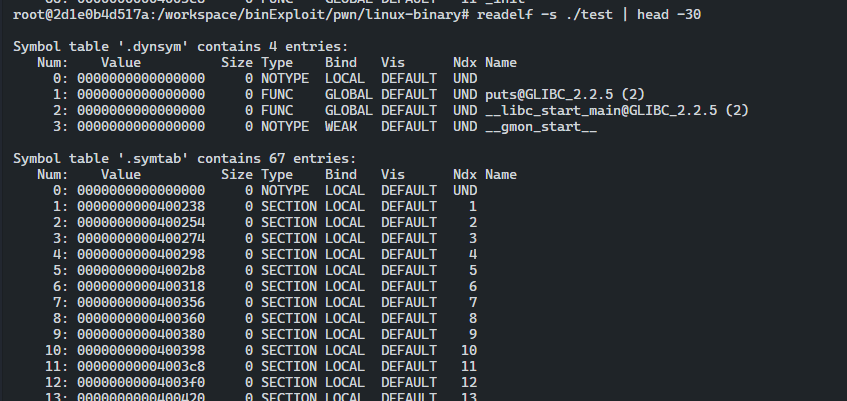
ELF file header
readelf -e ./test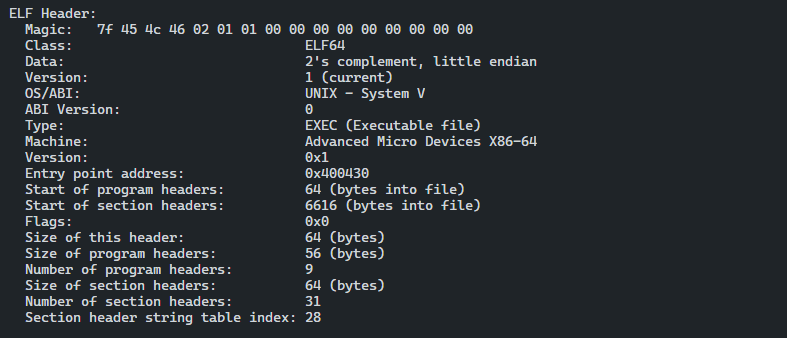
Relocation entries
readelf -r ./test
Dynamic segment
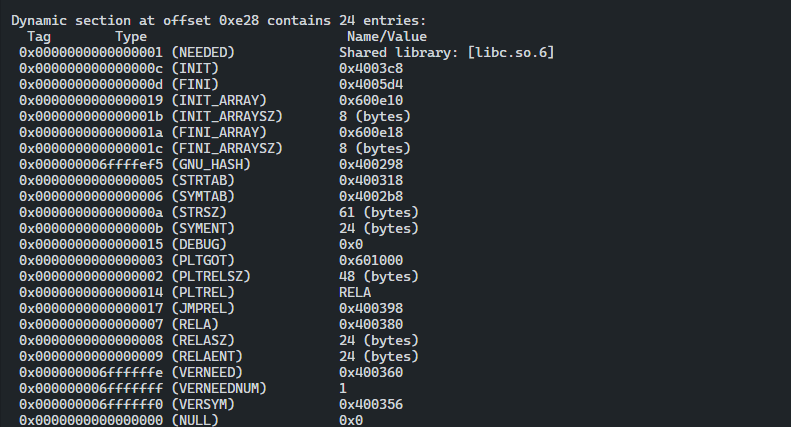
readelf -d ./test