archiveJan 3, 2021
Windows PEB (Process Environment Block)
How user-mode code reaches the PEB via FS:[30], what BeingDebugged / ImageBaseAddress / Ldr / ProcessHeap expose, and how module lists hang off PEB_LDR_DATA.
PEB (Process Environment Block)
The PEB is a Windows NT user-mode structure that holds process-wide state: image base, loader data, heaps, session id, and related flags.
Reaching the PEB
TEB.ProcessEnvironmentBlock points at the PEB. On x86, the TEB sits at the base of the segment selected by FS. ProcessEnvironmentBlock is at offset 0x30 from the TEB start:
FS:[30] = TEB.ProcessEnvironmentBlock = address of PEBMethod 1 — direct
MOV EAX, DWORD PTR FS:[30] ; FS[30] = address of PEBMethod 2 — via TEB
MOV EAX, DWORD PTR FS:[18]       ; FS[18] = address of TEB
MOV EAX, DWORD PTR DS:[EAX+30]   ; DS[EAX+30] = address of PEB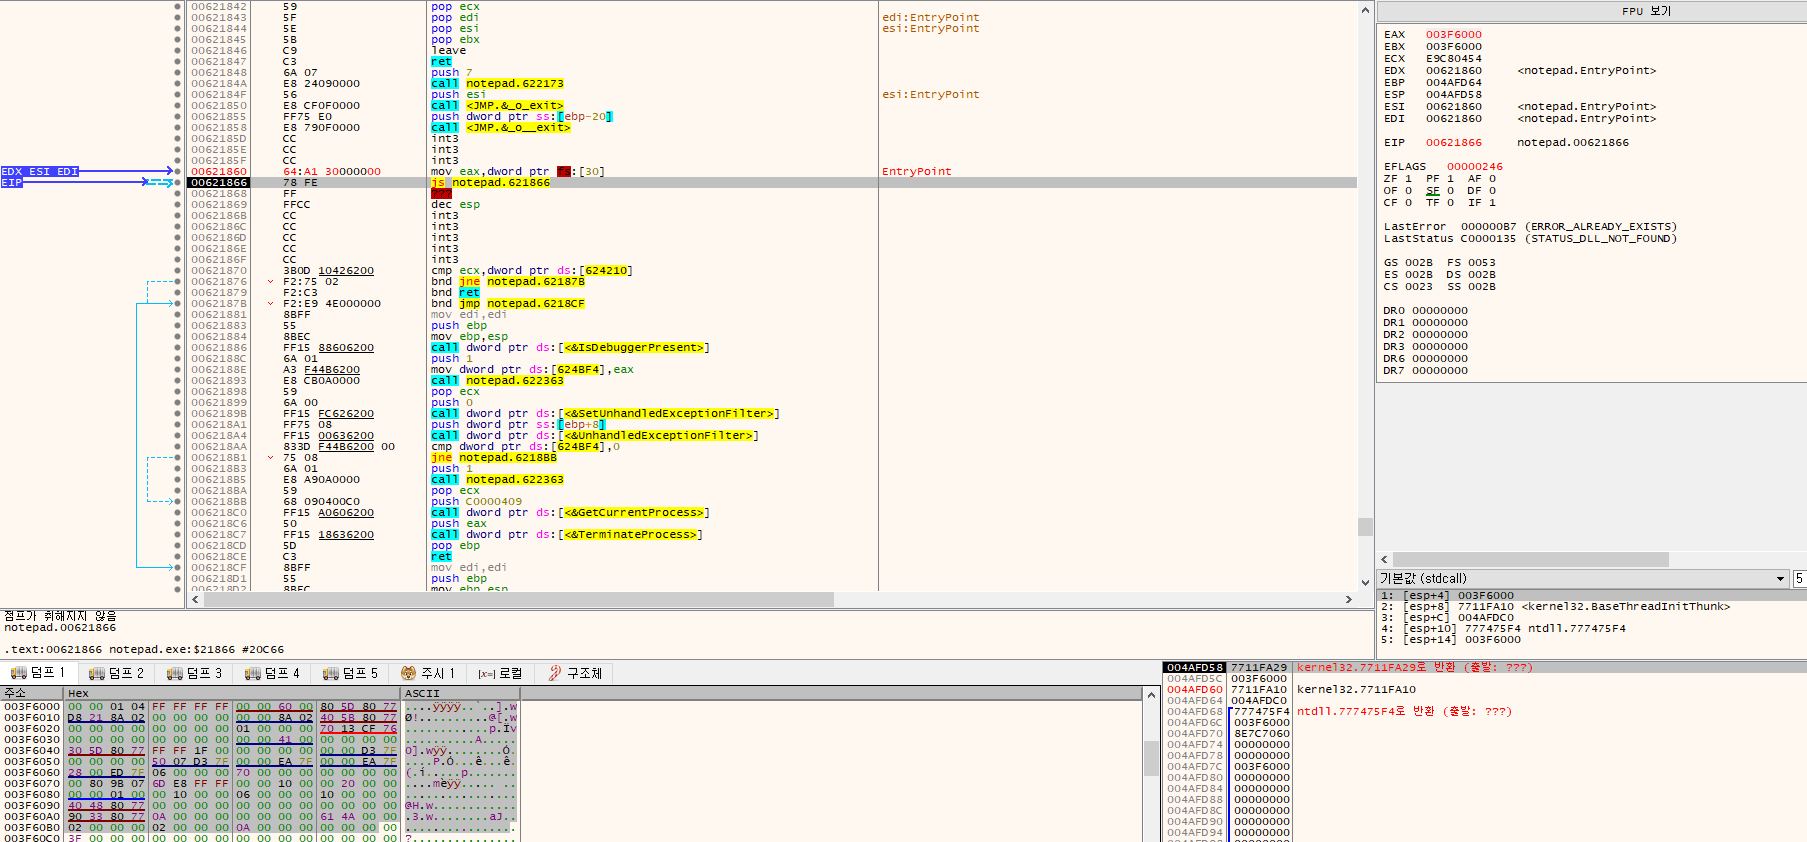
You can confirm the FS:[0x30] value in a debugger.
PEB layout (simplified)
typedef struct _PEB {
  BYTE                          Reserved1[2];
  BYTE                          BeingDebugged;
  BYTE                          Reserved2[1];
  PVOID                         Reserved3[2];
  PPEB_LDR_DATA                 Ldr;
  PRTL_USER_PROCESS_PARAMETERS  ProcessParameters;
  BYTE                          Reserved4[104];
  PVOID                         Reserved5[52];
  PPS_POST_PROCESS_INIT_ROUTINE PostProcessInitRoutine;
  BYTE                          Reserved6[128];
  PVOID                         Reserved7[1];
  ULONG                         SessionId;
} PEB, *PPEB;
Windbg dt ntdll!_PEB shows the fuller layout (offsets vary by architecture and build). Fields that show up constantly in analysis:
ntdll!_PEB
   +0x002 BeingDebugged    : UChar
   +0x010 ImageBaseAddress : Ptr64 Void
   +0x018 Ldr              : Ptr64 _PEB_LDR_DATA
   +0x030 ProcessHeap      : Ptr64 Void
PEB.BeingDebugged
Kernel32!IsDebuggerPresent() returns whether the current process is being debugged:
BOOL WINAPI IsDebuggerPresent(void);That API reads PEB.BeingDebugged (1 if debugged, 0 otherwise).
PEB.ImageBaseAddress
ImageBaseAddress holds the process image base. GetModuleHandle(NULL) returns the same base:
HMODULE WINAPI GetModuleHandle(
    __in_opt  LPCTSTR lpModuleName
);
Disassembly often loads PEB.ImageBaseAddress straight into a register.
PEB.Ldr
Ldr points at _PEB_LDR_DATA, which tracks modules loaded into the process:
typedef struct _PEB_LDR_DATA {
  BYTE       Reserved1[8];
  PVOID      Reserved2[3];
  LIST_ENTRY InMemoryOrderModuleList;
} PEB_LDR_DATA, *PPEB_LDR_DATA;0:007> dt _PEB_LDR_DATA
ntdll!_PEB_LDR_DATA
+0x000 Length : Uint4B
+0x004 Initialized : UChar
+0x008 SsHandle : Ptr32 Void
+0x00c InLoadOrderModuleList : _LIST_ENTRY
+0x014 InMemoryOrderModuleList : _LIST_ENTRY
+0x01c InInitializationOrderModuleList : _LIST_ENTRY
+0x024 EntryInProgress : Ptr32 Void
+0x028 ShutdownInProgress : UChar
+0x02c ShutdownThreadId : Ptr32 VoidThree doubly linked lists hang off this structure:
InLoadOrderModuleListInMemoryOrderModuleListInInitializationOrderModuleList
LIST_ENTRY is the usual Flink/Blink pair:
typedef struct _LIST_ENTRY {
	struct _LIST_ENTRY *Flink;
	struct _LIST_ENTRY *Blink;
} LIST_ENTRY, *PLIST_ENTRY;
Each list node is an _LDR_DATA_TABLE_ENTRY (one per loaded DLL), with fields such as DllBase, EntryPoint, and FullDllName:
typedef struct _LDR_DATA_TABLE_ENTRY {
    PVOID Reserved1[2];
    LIST_ENTRY InMemoryOrderLinks;
    PVOID Reserved2[2];
    PVOID DllBase;
    PVOID EntryPoint;
    PVOID Reserved3;
    UNICODE_STRING FullDllName;
    BYTE Reserved4[8];
    PVOID Reserved5[3];
    union {
        ULONG CheckSum;
        PVOID Reserved6;
    };
    ULONG TimeDateStamp;
} LDR_DATA_TABLE_ENTRY, *PLDR_DATA_TABLE_ENTRY;
Walking those lists is how user-mode code (and analysis tools) recover module bases without calling the usual Win32 helpers.
PEB.ProcessHeap and PEB.NtGlobalFlag
Like BeingDebugged, ProcessHeap and NtGlobalFlag change under a debugger and show up in anti-debug checks. When the process is debugged, those members take distinctive values that detectors compare against.